Over these months, we have continued with the implementation of the cost-effective energy monitoring system for municipal buildings, including the integration of energy data in the Santander Smart City platform and the definition of dashboards, as well as, a first analysis of energy data.
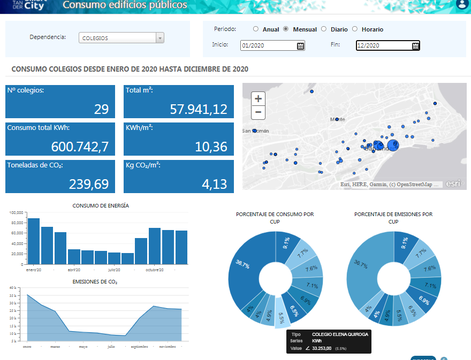
In terms of electricity, two types of dashboards have been defined. The first one allows the monitoring of electricity costs and consumption over time, based on monthly bills. The second one enables the monitoring of the electricity consumption and energy KPIs based on data coming from smart meters deployed in each municipal building. The following picture illustrates this second dashboard, where it is possible to choose the type of building (schools, sportive facilities, other municipal premises) as well as the data periodicity (annual, monthly, daily and hourly). In this example, electricity consumption, CO2 emissions and energy KPIs of the municipal schools from January to December 2020 are shown. This tool not only allows the analysis of energy parameters per group of buildings and for each building individually, but also facilitates benchmarking among buildings.

In parallel, energy data from a group of municipal schools has been analysed in collaboration with ESCAN. However, due to the pandemic situation, energy data in year 2020 are not representative enough, therefore, this work will be continued to draw some conclusions.
In the case of heating systems, we are still in discussions with the gas supplier to integrate data coming from gas bills into the Smart City platform and visualise it through a specific dashboard.